Delta Salmon Rearing Geospatial Analyses
15 Separate analysis layers were developed to help identify suitable Chinook salmon rearing habitat in the Sacramento-San Joaquin Delta. Descriptions of these layers are provided below
A_Depth_m.tif Water depth has been identified as an important parameter in salmon rearing habitat suitability indices from California and the Pacific Northwest. These indices are primarily developed for streams and fluvial floodplains. In tidal systems, as in fluvial systems, water depth influences the immediate environment a fish experiences, affecting hydrodynamics, prey availability, foraging efficiency, and predation risk. However, the relevant depth criteria are not as well understood in tidal areas. The water depth layer shown on this page was calculated using water depths at mean higher high water (MHHW) using a 10 meter digital elevation model (DEM).
B_Depth Suitability Index1.tif Suitable water depths, as mapped here, were adapted from criteria for the Lower Willamette River (Friesen 2005) and the Winter run central valley life cycle model (Hendrix et al. 2014). Areas with water depths of 0.2-1.5 meters were considered the most suitable, 1.5 to 3.0 meters was considered less suitable, and 3.0 to 6.0 m considered the least suitable. Areas less than 0.2 m or greater than 6 m deep were considered unsuitable.
C_Water Velocity_m_per_s_2.tif Water velocity has been shown to be in important parameter for salmon rearing habitat suitability indices in non-tidal areas, however, it is not as well understood how changes in water velocities and flow direction in the tidally dominated regions of the Delta influence migration and mortality (SST 2017). Velocities affect the energetic requirements of fish to move within the water, and can trigger fish to move in specific directions, including into or out of distributary channels. Greene et al., (2012) concluded that the fry exhaustion inducing threshold is 0.27 to 0.43 m/s; and CDFG (2002) and WDFW (2013) concluded that threshold to be 0.3 m/s. However, velocity matters on a very fine scale that is hard to measure. Hydrodynamic models developed by Resource Management Associates (RMA) are used here to visualize general patterns in average daily maximum velocity (m/s).
D_Wetland_and_Riparian_Vegetation.shp Wetland and riparian areas in the Delta support rearing salmon migrating through the Estuary by providing food and cover for fish, as well as affecting water flows and water quality. Leaf litter and macro-invertebrates associated with wetland and riparian vegetation provide a source of food for rearing fish. Vegetation along the edge of channels can provide shelter for fry. The extent of wetland and riparian areas in the Delta has been greatly reduced from their historical extent. This map shows tidal and non-tidal freshwater wetlands and woody riparian habitat types in the Delta. This data was used to create the “wetland proximity” and “weighted wetland edge” maps.
E_Submerged_and_Floating_Aquatic_Vegetation.tif SAV/FAV is abundant in parts of the Delta. The overall impact of this vegetation on rearing salmon has not been determined. SAV/FAV can increase water clarity, lower dissolved oxygen levels, and provide habitat for non-native fish that prey on salmon (Conrad 2016et al. 2016). However, SAV/FAV may also provide food resources, and reduce water velocities. The extent of submerged and floating aquatic vegetation has been mapped using remote sensing tools and field surveys (Hestir et al. 2016). SAV/FAV cover and abundance varies from year to year. This map shows SAV/FAV cover for 2015, a relatively high cover year compared to the previous years.
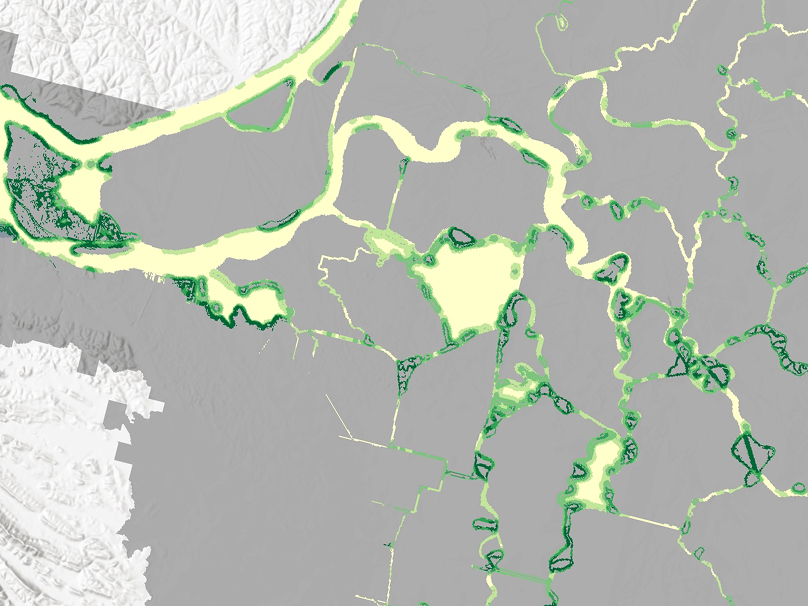
F_Channel_Network_Types.shp The types of channels found in the Delta provide different levels of support for rearing salmon. Channels that terminate in marshes (“blind channnels”) are often more heterogeneous than more connected “looped” channels, giving fish access to gradients in temperature, turbidity, and water velocity. These channels also provide fish with increased access to wetland resources. The dendritic channel networks once characterized much of the historical Delta but are uncommon in the Delta today. Loss of wetlands and increased connections between large channels, as a result of channel cuts, has reduced the number of blind channels in the Delta. These channel networks are more likely to develop in larger wetlands. Analysis of the historical Delta found the average size of wetland areas supporting dendritic channel networks was 500 ha (SFEI-ASC 2014).
G_Wetland_Proximity.tif Areas in closer proximity to wetlands were assumed to be more likely to benefit from the cover provided by wetlands, and therefore more suitable. Areas that were within 20 meters from a wetland were assigned the highest suitability. Suitability at distances greater than 20 m was assigned by quantile. Sites that are in proximity to other habitats were similarly prioritized in the Tillamook Bay Estuary (Ewald and Brophy 2012).
H_Wetland_Proximity_Suitability.tif We derived a weighted wetland edge (WWE) using methodology from the Kneib (2003) study that looked at the relationship between productivity, residency and density of nearby intertidal edge, which we applied to represent and quantify the accessibility and resourcefulness of wetlands for fish. In the highly modified Delta, an index based on only wetland edge effectively positively weights smaller, fragmented wetlands (with high edge-to-area ratios) and negatively weights larger, more intact wetlands (with lower edge-to-area ratios). To account for this, we factored in the aerial extent of the vegetated areas connected to the water’s edge. This approach is meant to identify areas where food resources from wetlands may be greater.
i_wwe (I_Weighted_Wetland_Edge) Suitability for weighted wetland edge was assigned by quantile. Areas with the highest weighted wetland edge scores were assigned the highest suitability. These were areas that are connected to large wetlands and where there is a lot of intersection between wetland and water.
J_Weighted_Wetland_Edge_Suitability.tif Water temperature is an important factor that affects salmon physiology, growth and energetics. Water that is too hot can cause stress, disease and increased mortality. High temperatures can enhance productivity up to a point, but will also increase mortality once exceeded. Juvenile Chinook salmon prefer temperatures from 15 C to 22.5 C during the summer months (Kagley et al., 2005). Though temperature is an especially significant parameter, it is difficult to map at a scale relevant to individual fish. This map shows the percent of number of days the water channel is above 19 C between November and May, across a 9 year time period. We chose the threshold of 19 C because water temperatures did not reach above 21 C enough to visualize landscape scale patterns.
K_Water_Temperature_degC.tif Water temperature is an important factor that affects salmon physiology, growth and energetics. Water that is too hot can cause stress, disease and increased mortality. High temperatures can enhance productivity up to a point, but will also increase mortality once exceeded. Juvenile Chinook salmon prefer temperatures from 15 C to 22.5 C during the summer months (Kagley et al., 2005). Though temperature is an especially significant parameter, it is difficult to map at a scale relevant to individual fish. This map shows the percent of number of days the water channel is above 19 C between November and May, across a 9 year time period. We chose the threshold of 19 C because water temperatures did not reach above 21 C enough to visualize landscape scale patterns.
L_Water_Temperature_Suitability.tif Water temperature data was converted to suitability values by splitting the data into quantiles and assigning lower suitability to areas with higher water temperatures. Areas where temperatures were above 19 C for a greater number of days were assumed to provide less suitable habitat.
M_Combined_Habitat_Suitability.tif Looking at individual habitat parameters separately is of limited value because criteria for multiple habitat parameters must be met in order for an area to truly provide suitable rearing habitat. However, considering suitability across parameters is challenging because 1) suitability has not been determined for all important parameters, and 2) there is uncertainty around which habitat parameters are most important, and whether there are interactions between parameters, both of which are important for determining how criteria for individual parameters should be combined. The combined suitability map presented here was created by taking the geometric mean of suitability scores for the four parameters for which suitability was assessed: weighted wetland edge, wetland adjacency, water depth, and water temperature. Numeric weights were given to reflect relative suitability for each of the criteria. Suitability values ranged from 0 (unsuitable) to 100 (most suitable). Water depth was the only criteria that had values weighted zero. This combined map is meant to be an initial look at how parameters might be combined and is expected to be refined in future efforts as data availability and our understanding of salmon rearing habitat in the Delta increases.
N_Distance_to_all_Wetlands.tif Patterns in the distribution of habitat across the landscape impact the frequency at which juvenile salmon are likely to encounter suitable rearing conditions as they migrate through the Delta. Here we mapped the network distance (distance along channels) to the nearest wetland for all tidal open water areas. Distances are categorized using the average distance that fry and smolt move in a day (2 km and 15 km respectively). In areas where wetlands are more than 2 km away, fry are unlikely to encounter wetlands within a day. In areas where wetlands are more than 15 km away, smolt are unlikely to encounter wetlands within a day. This map shows there are relatively few areas in the Delta where fry are more than one day’s journey away from wetlands, and no areas where smolt are more than one day’s journey from wetlands.
O_Distance_to_Large_Wetland_Patches.tif Large wetlands likely provide more benefit to rearing salmon than smaller wetlands, particularly in terms of food production and channel network structure. Here we repeat the analysis from the previous page, looking at the distance to large wetlands. Large wetlands here are defined as being greater than 500 ha, a size associated with dendritic channel networks in the Delta historically (SFEIASC 2014). This map shows there are large areas of the Delta where fry are more than one day’s journey from large wetland areas, and substantial portions of the Delta, particularly in the South Delta, where smolt are more than one day’s journey from large wetland areas.
References Cited
CDFG (California Department of Fish and Game). 2002. Culvert Criteria for Fish Passage.
Conrad, J.L., Bibian, A.J., Weinersmith, K.L., De Carion, D., Young, M.J., Crain, P., Hestir, E.L., Santos, M.J. and Sih, A., 2016. Novel species interactions in a highly modified estuary: association of Largemouth Bass with Brazilian waterweed Egeria densa. Transactions of the American Fisheries Society, 145(2), pp.249-263.
Ewald, M. and L. Brophy. 2012. Tidal wetland prioritization for the Tillamook Bay Estuary. Prepared for Tillamook Estuaries Partnership, Garibaldi, Oregon. Available at: https://www.wildsalmoncenter.org/content/uploads/2016/03/TillamookWetlan... FINAL.pdf
Friesen, T.A. 2005. Biology, behavior, and resources of resident and anadromous fish in the Lower Willamette River: Final report of research 2000-2004. Oregon Department of Fish and Wildlife.
Greene, C.M. and E.M. Beamer. 2011. Monitoring population responses to estuary restoration by Skagit River Chinook salmon. Intensively monitored watershed project, annual report 2011. Northwest Fisheries Science Center and Skagit River System Cooperative.\
Hestir, E.L., Schoellhamer, D.H., Greenberg, J. et al. The Effect of Submerged Aquatic Vegetation Expansion on a Declining Turbidity Trend in the Sacramento-San Joaquin River Delta. Estuaries and Coasts 39, 1100–1112 (2016). https://doi.org/10.1007/s12237-015-0055-z
Kagley, A.N., K. Fresh, S. Hinton, G.C. Roegner, D.L. Bottom & E. Casillas. 2005. Habitat Use by Juvenile Salmon in the Columbia River Estuary: Columbia River Channel Improvement Project Research. NMFS Northwest Fisheries Science Center. Prepared for USACE Portland District.
Kneib, R.T., 2003. Bioenergetic and landscape considerations for scaling expectations of nekton production from intertidal marshes. Marine Ecology Progress Series, 264, pp.279-296.
Salmon Scoping Team, 2017. Effects of Water Project Operations on Juvenile Salmonid Migration and in the South Delta. Report prepared for the Collaborative Adaptive Management Team, January 2017.
San Francisco Estuary Institute-Aquatic Science Center (SFEI-ASC). 2014. A Delta Transformed: Ecological Functions, Spatial Metrics, and Landscape Change in the Sacramento-San Joaquin Delta. Prepared for the California Department of Fish and Wildlife and Ecosystem Restoration Program. A Report of SFEI-ASC’s Resilient Landscapes Program, Publication #729, San Francisco Estuary Institute-Aquatic Science Center, Richmond, CA
WDFW (Washington Department of Fish and Wildlife). 2013. Water Crossing Design Guidelines. Available at:https://wdfw.wa.gov/publications/01501/
Creation Date:
Friday, February 14, 2020
Last Updated:
Friday, February 14, 2020
Type of Data:
GIS vector dataset
GIS imagery/raster
Programs and Focus Areas:
Terrestrial Ecology