Library
Our library features many hundreds of entries.
To search among them, click "Search" below to pull down options, including filtering by document type, author, year, and keyword.
Find these options under "Show only items where." Or you can also sort by author, title, type, and year clicking the headings below.
2024. Selenium Concentrations in Water and Clams in North San Francisco Bay, 2019-2020. SFEI Contribution No. 1116. San Francisco Estuary Institute: Richmond, CA.
The Regional Monitoring Program for Water Quality in San Francisco Bay (RMP) started implementing a new design for North Bay selenium (Se) sampling in 2019 after a long-term USGS program was terminated in 2017. To determine if the RMP sampling and analysis methods are producing similar results to the USGS study, we compared Se concentrations and stable isotope values in clams at two stations in Suisun Bay, California, that were sampled by the USGS long-term monitoring program from 1995-2010 and the RMP in 2019-2020. We also compared Se concentrations in water (dissolved and particulate) from the RMP Status and Trends sampling in Suisun Bay (1993-2019) to the samples collected as part of this study.
Spatial patterns in clam Se concentrations between the USGS and RMP studies were similar, with lower concentrations at Station 4.1 (Suisun Bay) than at Station 8.1 (Carquinez Strait). Se concentrations at both stations were consistently lower for the RMP samples than those reported in the long-term USGS dataset. Stable isotope values for δ13C and δ15N were similar for the USGS and RMP samples with δ13C and δ15N more enriched at Station 8.1 than 4.1. However, there was not close alignment of the RMP samples to the USGS long-term average, particularly at Station 8.1. Average dissolved Se concentrations in water were consistently lower than the long-term average at Station 4.1 and similar to or above the long-term RMP Status and Trends (S&T) average at Station 8.1. Particulate Se concentrations at Stations 4.1 and 8.1 were nearly one-third of the long-term S&T average in Suisun Bay, likely due to a change in methods for calculating particulate Se.
Additional information is needed to evaluate whether the lower Se concentrations measured in clams as part of the RMP study could be suggestive of declining Se concentrations in North Bay clams between 2010 and 2019 or an artifact of the new analytical lab. Additional data from samples collected by the USGS from 2011-2017 should be examined to fill the gap between the datasets. Continued RMP monitoring will also be valuable in evaluating long-term trends.
2023. San Francisco Bay Sediment Modeling and Monitoring Workplan. SFEI Contribution No. 1100. San Francisco Estuary Institute: Richmond, CA.
This document was prepared with guidance gained through two RMP Sediment Workgroup workshops held in late 2022 and early 2023. Given the variety of participants involved, this Workplan encompasses interests beyond San Francisco Bay RMP funders. We thank the attendees for their contributions.
In 2020, the Sediment Workgroup (SedWG) of the Regional Monitoring Program for Water Quality in San Francisco Bay (RMP) completed a Sediment Monitoring and Modeling Strategy (SMMS) which laid out a conceptual level series of data and information gaps and generally recommended the use of both empirical data collection and modeling tools to answer initial high priority management questions (McKee et al., 2020). At the time, the SMMS promoted the use of surrogates such as time-continuous turbidity measurements for cross-section flux modeling within the Bay without an understanding of existing Bay hydrodynamic models, their strengths, weaknesses, and potential uses for understanding coupled Bay-mudflat-marsh processes. Since then, the Wetland Regional Monitoring Program (WRMP, www.wrmp.org) has generally promoted the use of coupling monitoring and modeling techniques to inform wetlands sediment management decisions. In addition, he completion of the Sediment for Survival report (a RMPEPA funded collaboration) and the further development of sediment conceptual models has also advanced the need for a coupled dynamic modeling and monitoring program that has the capacity to explore more complex management questions (Dusterhoff et al., 2021; SFEI, 2023). Such a program will take time to develop, but will be more cost-efficient and adaptable and allow for more timely answers to pressing questions.
2023. Sediment Deposition and Accretion Data from a Tidal Salt Marsh in South San Francisco Bay, California 2021-2022. U.S. Geological Survey Western Ecological Research Center .
The U.S. Geological Survey, Western Ecological Research Center collected sediment and accretion data at a wave-exposed tidal salt marsh in South San Francisco Bay, California. Sediment traps and feldspar marker horizons (MH) were deployed along transects of increasing distance from the sediment source, at primary, secondary and tertiary marsh channels/bay. Data were collected bi-monthly over two month periods in summer 2021 and winter 2021/2022. Included here are trap and MH plot locations, calculated sediment fluxes at each station by deployment period, annual accretion rates, and covariates associated with sediment deposition and accretion including vegetation structure and elevation. This project aimed to assess the temporal and spatial patterns in sediment deposition in order to better understand sediment delivery and marsh resilience to sea-level rise.
2023. Sediment deposition, erosion, and bathymetric change in San Francisco Bay, California, 1971–1990 and 1999–2020. United States Geological Survey Pacific Coastal and Marine Science Center: Santa Cruz, CA.
Bathymetric change analyses document historical patterns of sediment deposition and erosion, providing valuable insight into the sediment dynamics of coastal systems, including pathways of sediment and sediment-bound contaminants. In 2014 and 2015, the Office for Coastal Management, in partnership with the National Oceanic and Atmospheric Administration (NOAA) Office of Coastal Management, provided funding for new bathymetric surveys of large portions of San Francisco Bay. A total of 93 bathymetric surveys were conducted during this 2-year period, using a combination of interferometric sidescan and multibeam sonar systems. These data, along with recent NOAA, U.S. Geological Survey (USGS), U.S. Army Corps of Engineers, and private contractor surveys collected from 1999 to 2020 (hereinafter referred to as 2010s), were used to create the most comprehensive bathymetric digital elevation models (DEMs) of San Francisco Bay since the 1980s. Comparing DEMs created from these 2010s surveys with USGS DEMs created from NOAA’s 1971–1990 (hereinafter referred to as 1980s) surveys provides information on the quantities and patterns of erosion and deposition in San Francisco Bay during the 9 to 47 years between surveys. This analysis reveals that in the areas surveyed in both the 1980s and 2010s, the bay floor lost about 34 million cubic meters of sediment since the 1980s. Results from this study can be used to assess how San Francisco Bay has responded to changes in the system, such as sea-level rise and variation in sediment supply from the Sacramento-San Joaquin Delta and local tributaries, and supports the creation of a new, system-wide sediment budget. This report provides data on the quantities and patterns of sediment volume change in San Francisco Bay for ecosystem managers that are pertinent to various sediment-related issues, including restoration of tidal marshes, exposure of legacy contaminated sediment, and strategies for the beneficial use of dredged sediment.
2023. Sediment Deposition, Erosion, and Bathymetric Change in San Francisco Bay, California, 1971–1990 and 1999–2020. United State Geological Survey: Santa Cruz, CA.
Bathymetric change analyses document historical patterns of sediment deposition and erosion, providing valuable insight into the sediment dynamics of coastal systems, including pathways of sediment and sediment-bound contaminants. In 2014 and 2015, the California Ocean Protection Council, in partnership with the National Oceanic and Atmospheric Administration (NOAA) Office of Coastal Management, provided funding for new bathymetric surveys of large portions of San Francisco Bay. A total of 93 bathymetric surveys were conducted during this 2-year period, using a combination of interferometric sidescan and multibeam sonar systems. These data, along with recent NOAA, U.S. Geological Survey (USGS), U.S. Army Corps of Engineers, and private contractor surveys collected from 1999 to 2020 (hereinafter referred to as 2010s), were used to create the most comprehensive bathymetric digital elevation models (DEMs) of San Francisco Bay since the 1980s. Comparing DEMs created from these 2010s surveys with USGS DEMs created from NOAA’s 1971–1990 (hereinafter referred to as 1980s) surveys provides information on the quantities and patterns of erosion and deposition in San Francisco Bay during the 9 to 47 years between surveys. This analysis reveals that in the areas surveyed in both the 1980s and 2010s, the bay floor lost about 34 million cubic meters of sediment since the 1980s. Results from this study can be used to assess how San Francisco Bay has responded to changes in the system, such as sea-level rise and variation in sediment supply from the Sacramento-San Joaquin Delta and local tributaries, and supports the creation of a new, system-wide sediment budget. This report provides data on the quantities and patterns of sediment volume change in San Francisco Bay for ecosystem managers that are pertinent to various sediment-related issues, including restoration of tidal marshes, exposure of legacy contaminated sediment, and strategies for the beneficial use of dredged sediment.
2023. Stevens Creek Reservoir – Forecast Informed Reservoir Operation (FIRO) Phase One Report. . SFEI Contribution No. 1120. Prepared for SCV Water District.
2023. Structure-from-motion derived orthomosaic imagery and digital surface models (DSMs) from the intertidal region at Whale's Tail Marsh, South San Francisco Bay, CA. United States Geological Survey: South San Francisco Bay, CA.
This data release presents digital surface models (DSMs) and orthomosaic images of the Whale's Tail Marsh region of South San Francisco Bay, CA. The data were created using structure-from-motion (SfM) processing of repeat aerial imagery collected from fixed-wing aircraft. The raw images were acquired from an approximate altitude of 427 meters (1,400 feet) above ground level (AGL), using a Hasselblad A6D-100c camera fitted with an HC 80 lens, resulting in a nominal ground-sample-distance (GSD) of 2.5 centimeters per pixel. The acquisition flight lines were designed to provide approximately 50 percent overlap between adjacent flight lines (sidelap), with approximately 70 percent overlap between sequential images along the flight line (forelap). Survey control was established using an onboard camera-synchronized dual-frequency GPS system as well as ground control points (GCPs) distributed throughout the survey area and measured using survey-grade post-processed kinematic (PPK) GPS. Both the data from the onboard GPS and from the GPS used to measure the GCPs were post-processed using a nearby Continuously Operating Reference Station (CORS) operated by the National Geodetic Survey (NGS). Structure-from-motion processing of these data was conducted using a "4D" processing workflow in which imagery from each of the different acquisition dates were co-aligned to increase relative spatial precision between the final data products.
2023. Suspended Sediment Loads Analysis of Four Creeks in the San Francisco Bay Area. SFEI Contribution No. 1134. San Francisco Estuary Institute: Richmond, CA.
. 2023. Sycamore Alluvial Woodland Pilot Study Implementation Guidelines. Prepared for Zone 7 Water Agency and US Environmental Protection Agency’s Water Quality Improvement Fund. In collaboration with San Francisco Estuary Institute.
This document supports planting-based approaches for sycamore enhancement by providing site-level revegetation techniques for installing, maintaining and monitoring sycamore plantings.
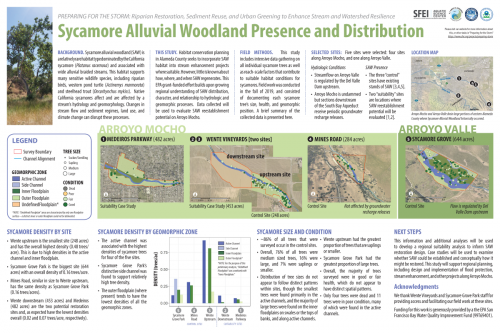
2023. Sycamore Alluvial Woodland Restoration and Enhancement Suitability Study. In collaboration with Alameda County Flood Control and Water Conservation District, Zone 7. Prepared for the US Environmental Protection Agency’s Water Quality Improvement Fund. SFEI Contribution No. 1128. San Francisco Estuary Institute: Richmond, CA.
 The “Sycamore Alluvial Woodland Restoration and Enhancement Suitability Study” addresses distribution and regeneration patterns and restoration strategies of sycamore alluvial woodland (SAW) habitat, a unique and relatively rare native vegetation community adapted to California’s intermittent rivers and streams. The report was produced by SFEI and H. T. Harvey & Associates, as part of the US EPA Water Quality Improvement Fund Preparing for the Storm grant, led by Zone 7 Water Agency.
2022. San Francisco Bay Watershed Dynamic Model (WDM) Progress Report, Phase 2. SFEI Contribution No. 1091. San Francisco Estuary Institute: Richmond, California.
The San Francisco Bay total maximum daily loads (TMDLs) call for a 50% reduction in mercury (Hg) loads by 2028 and a 90% reduction in PCBs loads by 2030. In support of these TMDLs, the Municipal Regional Permit for Stormwater (MRP) (SFBRWQCB, 2009, SFBRWQCB, 2015, SFBRWQCB, 2022) called for the implementation of control measures to reduce PCBs and Hg loads from urbanized tributaries. In addition, the MRP has identified additional information needs associated with improving understanding of sources, pathways, loads, trends, and management opportunities of pollutants of concern (POCs). In response to the MRP requirements and information needs, the Small Tributary Loading Strategy (STLS) was developed, which outlined a set of management questions (MQs) that have been used as the
guiding principles for the region’s stormwater-related activities. In recognition of the need to evaluate changes in loads or concentrations of POCs from small tributaries on a decadal scale, the updated 2018 STLS Trends Strategy (Wu et al., 2018) prioritized the development of a new dynamic regional watershed model for POCs (PCBs and Hg focused) loads and trends. This regional modeling effort will provide updated estimates of POC concentrations and loads for all local watersheds that drain to the Bay. The Watershed Dynamic Model (WDM) will also provide
a mechanism for evaluating the impact of management actions on future trends of POC loads or concentrations.
As a multi-use modeling platform, the WDM is being developed to include other pollutants, such as contaminants of emerging concern (CECs), sediment, and nutrients and to be coupled with a Bay fate model to form an integrated watershed-Bay modeling framework to address Regional Monitoring Program (RMP) management questions. As this model is developed, flexibility to link with other models will be an important consideration.
2022. Shallow Groundwater Response to Sea-Level Rise: Alameda, Marin, San Francisco, and San Mateo Counties. Pathways Climate Institute and San Francisco Estuary Institute.
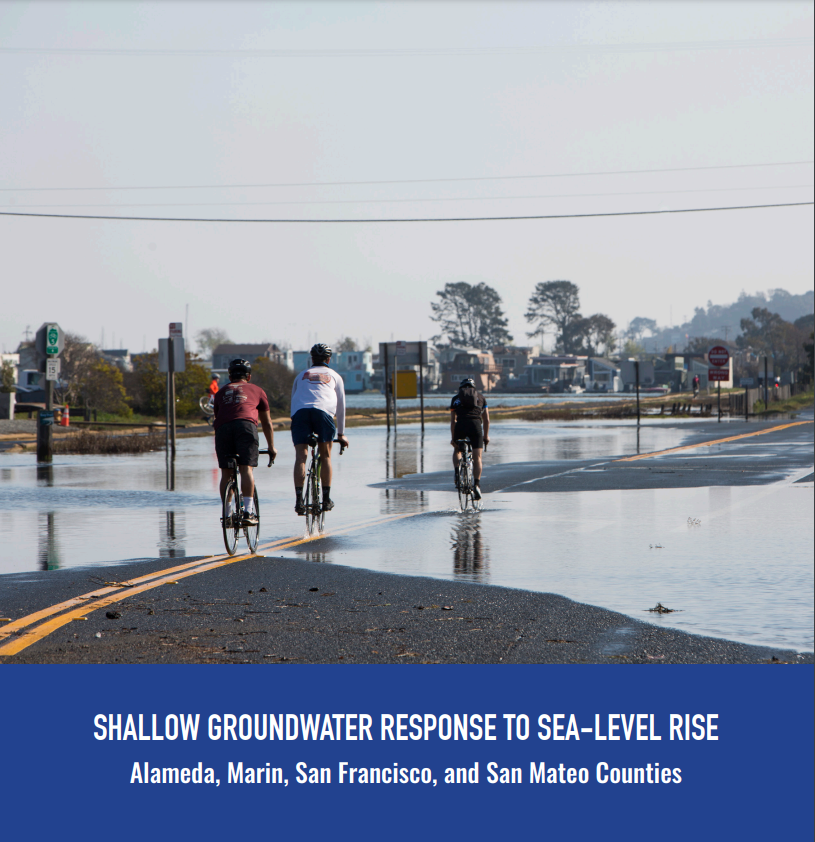 The response of shallow groundwater to sea-level rise is a relatively new field of study. For low-lying coastal communities, sea-level rise adaptation efforts must consider the potential for groundwater rise to avoid maladaptation. The need to better understand this slow and chronic threat was identified as a critical data gap in the San Francisco Bay Area’s (Bay Area’s) adaptation efforts during the Bay Area Groundwater and Sea-Level Rise Workshop in 2019.
Pathways Climate Institute LLC (Pathways) and the San Francisco Estuary Institute (SFEI) gathered and analyzed multiple data sets and collaborated with city and county partners to analyze and map the existing “highest annual” shallow groundwater table and its likely response to future sea-level rise. This effort covers four counties (Alameda, Marin, San Francisco, San Mateo) and was funded by the Bay Area Council’s California Resilience Challenge. The study focused on the San Francisco Bay side of each county and does not include the Pacific coastline of Marin, San Francisco, nor San Mateo Counties. An advisory committee composed of city and county representatives provided essential support by gathering data and reviewing depth-to-groundwater maps. Additional academic and agency advisors participated in project team meetings and informed project direction. This effort produced the following publicly available data and online tools to support adaptation efforts:
- Existing and future condition depth to groundwater GIS data available for download (geodatabase format).
- A StoryMap providing background information and graphical representations of the processes and impacts of groundwater rise.
- Web maps showing: (1) existing depth to groundwater; and (2) a comparison of the extent of emergent groundwater to the extent of coastal flooding under various sea-level-rise scenarios.
2022. Small Tributaries Pollutants of Concern Reconnaissance Monitoring: Application of Storm-event Loads and Yields-Based and Congener-Based PCB Site Prioritization Methodologies. SFEI Contribution No. 1067.
Stormwater agencies in the San Francisco Bay Area are identifying watershed areas that are polluted with PCBs in order to prioritize management efforts to reduce impairment in the Bay caused by PCBs carried in stormwater. Water sampling during storms has been used to characterize PCB concentrations but management prioritization based on the comparison of concentrations between watersheds is made difficult due to variations in flow and sediment erosion between storms and in relation to varying land use. In addition, identifying PCB source areas within priority watersheds has proven complex and costly. To address these challenges, the San Francisco Bay Regional Monitoring Program (RMP) has developed two new interpretive methods based on storm-event PCB yields (PCBs mass per unit area per unit time) and fingerprints of Aroclors (commercial PCB mixtures) that make existing data more useful for decision-making.
The objectives of this study were to:
- Apply the yield method to the regional stormwater dataset and provide new rankings,
- Estimate the presence of Aroclors in samples where congener data are available
- Evaluate data weaknesses and recommend watersheds to resample, and
- Classify watersheds into high, medium, and low categories for potential management.
2022. Strategy for In-Bay Fate Modeling to Support Contaminant and Sediment Management in San Francisco Bay. SFEI Contribution No. 1090. San Francisco Estuary Institute: Richmond, California.
This report presents a strategy and multi-year workplan for modeling polychlorinated biphenyls (PCBs), contaminants of emerging concern (CECs), and sediment in San Francisco Bay (the Bay). Robust in-Bay fate modeling is needed to address priority management questions that have been identified for these constituents.
The strategy for in-Bay modeling presented in this report is a major element of a broader, integrated strategy that is being developed across RMP Workgroups for modeling contaminants flowing from the Bay watersheds and other pathways into the Bay. The broader project is expected to yield an integrated strategy in 2022, followed by implementation of a pilot effort in 2023. Coordination of the in-Bay modeling effort with the broader integrated strategy and other modeling work (e.g., nutrient modeling under the Nutrient Management Strategy) will be critical to optimizing use of the funds allocated to modeling.
2022. Study of Per- and Polyfluoroalkyl Substances in Bay Area POTWs: Phase 2 Sampling and Analysis Plan. San Francisco Estuary Institute: Richmond, CA.
2022. Summary and Evaluation of Bioaccumulation Tests for Total Polychlorinated Biphenyls (PCBs) Conducted by San Francisco Bay Dredging Projects. SFEI Contribution No. 1092. San Francisco Estuary Institute: Richmond, California.
The Dredged Material Management Office (DMMO) is responsible for annually approving dredging and disposal of millions of cubic yards of sediment to maintain safe navigation in San Francisco Bay. Dredged sediment is characterized for physical, chemical, and biological characteristics to ensure sediment disposed of in the Bay or at beneficial use locations does not cause adverse environmental impacts. Bioaccumulation thresholds and total maximum daily loads (TMDLs) have been established for several contaminant classes, including PCBs, and are used by the DMMO to determine whether sediment contaminant levels trigger subsequent bioaccumulation testing. Sediment with contaminant concentrations above any TMDL levels cannot be disposed of within the Bay but may be further evaluated for upland reuse and ocean disposal. The objective of this study was to evaluate PCB bioaccumulation data from navigational dredging projects to assess the existence of correlations between sediment chemistry and bioaccumulation test results. The motivation for this study was to determine whether the current PCB bioaccumulation trigger is effective in differentiating sediment bioaccumulation concerns. The DMMO may use the results of this study to inform evaluation requirements for PCBs, particularly in support of modifying the terms of the Long-term Management Strategy for San Francisco Bay (LTMS) programmatic Essential Fish Habitat (EFH) agreement concerning PCB bioaccumulation testing.
2022. Suspect Screening and Chemical Profile Analysis of Storm-Water Runoff Following 2017 Wildfires in Northern California. Environmental Toxicology and Chemistry . SFEI Contribution No. 1089.
The combustion of structures and household materials as well as firefighting during wildfires lead to releases of potentially hazardous chemicals directly into the landscape. Subsequent storm-water runoff events can transport wildfire-related contaminants to downstream receiving waters, where they may pose water quality concerns. To evaluate the environmental hazards of northern California fires on the types of contaminants in storm water discharging to San Francisco Bay and the coastal marine environment, we analyzed storm water collected after the northern California wildfires (October 2017) using a nontargeted analytical (NTA) approach. Liquid chromatography quadrupole time-of-flight mass spectrometric analysis was completed on storm-water samples (n = 20) collected from Napa County (impacted by the Atlas and Nuns fires), the city of Santa Rosa, and Sonoma County (Nuns and Tubbs fires) during storm events that occurred in November 2017 and January 2018. The NTA approach enabled us to establish profiles of contaminants based on peak intensities and chemical categories found in the storm-water samples and to prioritize significant chemicals within these profiles possibly attributed to the wildfire. The results demonstrated the presence of a wide range of contaminants in the storm water, including surfactants, per- and polyfluoroalkyl substances, and chemicals from consumer and personal care products. Homologs of polyethylene glycol were found to be the major contributor to the contaminants, followed by other widely used surfactants. Nonylphenol ethoxylates, typically used as surfactants, were detected and were much higher in samples collected after Storm Event 1 relative to Storm Event 2. The present study provides a comprehensive approach for examining wildfire-impacted storm-water contamination of related contaminants, of which we found many with potential ecological risk. Environ Toxicol Chem 2022;00:1–14. © 2022 SETAC
2021. San Francisco Bay North Bay Margins Sediment Report. Marine Pollution Studies Lab: Moss Landing, California.
This report contains information on the late summer/early fall field sampling efforts conducted
by the Marine Pollution Studies Lab at Moss Landing Marine Labs (MPSL-MLML) in support of
the San Francisco Bay Regional Monitoring Program (RMP) North Bay (San Pablo and Suisun
Bays) Margins study. The North Bay Margins is the third and final round of a larger San
Francisco Bay study collecting sediment and water in shallow margin areas of the bay. The first
round was conducted in Central Bay in 2015 and second round in South Bay in 2017. The work
was contracted through the San Francisco Estuary Institute (SFEI) to the San Jose State
University Research Foundation (SJSURF).
This report includes sample collections over a three week period (August 31st through September
16th) in 2020 encompassing two trips. A total of 40 sediment sites were sampled (Appendix A).
Duplicate sediment samples were collected at two sites (SPB039 and SUB25). Detailed sample
counts and protocols can be found in the 2020 RMP Bay Margins Sediment Cruise Plan prepared
by SFEI.
2021. San Francisco Bay Regional Watershed Modeling Progress Report, Phase 1. SFEI Contribution No. 1038. San Francisco Estuary Institute: Richmond, CA.
2021. The San Francisco Estuary Institute Collection at the NIST Biorepository. NIST Interagency/Internal Report (NISTIR) - 8370. SFEI Contribution No. 1039. National Institute of Standards and Technology: Gaithersburg, MD.
The National Institute of Standards and Technology (NIST) has been collaborating with the San Francisco Bay Estuary Institute (SFEI) since 2009, providing biobanking services at the NIST Biorepository in Charleston, South Carolina in support of their ongoing water quality monitoring program, the Regional Monitoring Program for Water Quality in the San Francisco Bay (RMP). Specimens (bivalve tissue, bird egg contents, fish tissue and sediment) are collected and processed by SFEI-partnering institutions according to their established protocols and shipped to the NIST Biorepository for archival. This report outlines NIST's role in the project, describes collection and processing protocols developed by SFEI and their collaborators, details shipping and archival procedures employed by biorepository staff and provides an inventory of the collection maintained by NIST from 2009 to 2020.
2021. Sediment for Survival: A Strategy for the Resilience of Bay Wetlands in the Lower San Francisco Estuary. SFEI Contribution No. 1015. San Francisco Estuary Institute: Richmond, CA.
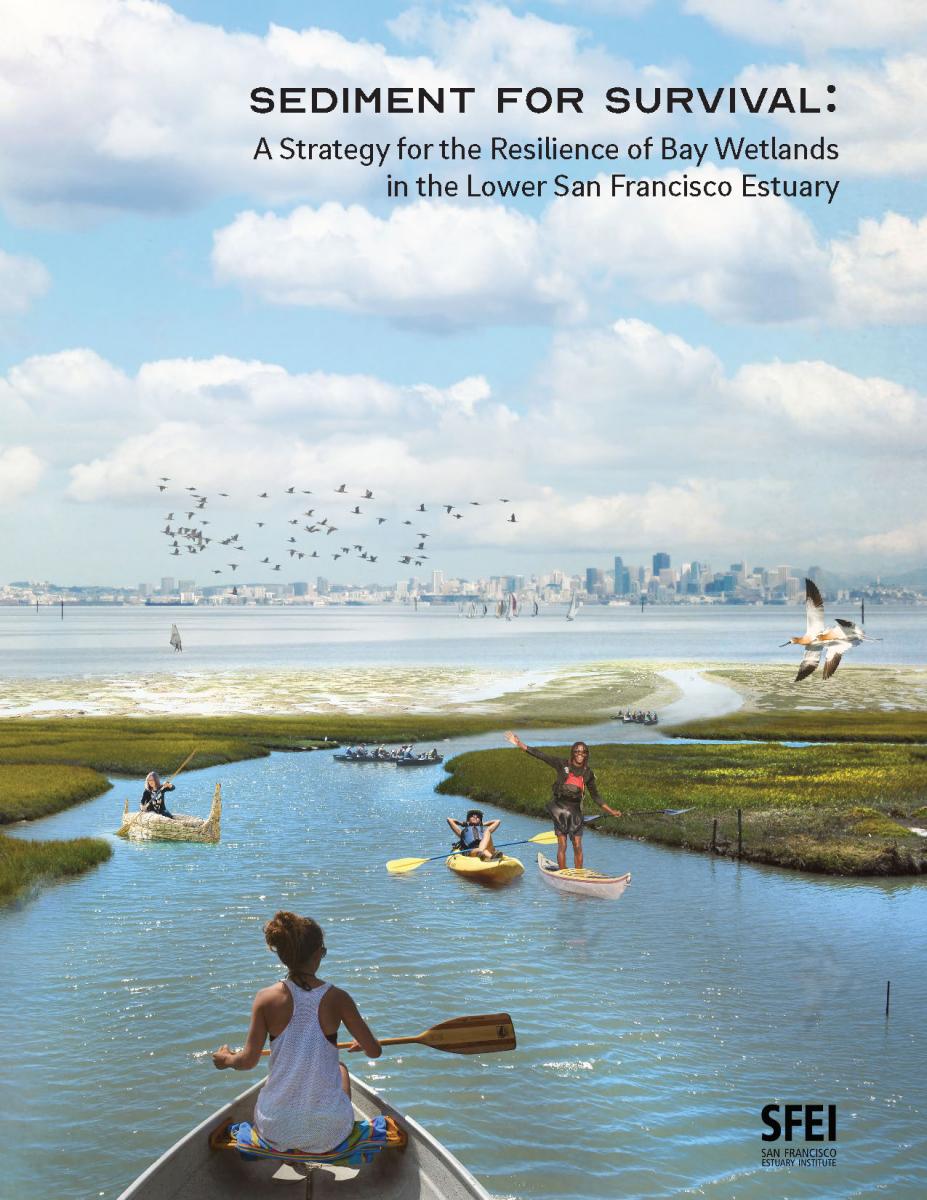
This report analyses current data and climate projections to determine how much natural sediment may be available for tidal marshes and mudflats and how much supplemental sediment may be needed under different future scenarios. These sediment supply and demand estimates are combined with scientific knowledge of natural physical and biological processes to offer a strategy for sediment delivery that will allow these wetlands to survive a changing climate and provide benefits to people and nature for many decades to come. The approach developed in this report may also be useful beyond San Francisco Bay because shoreline protection, flood risk-management, and looming sediment deficits are common issues facing coastal communities around the world.
The resilience of San Francisco Bay shore habitats, such as tidal marshes and mudflats, is essential to all who live in the Bay Area. Tidal marshes and tidal flats (also known as mudflats) are key components of the shore habitats, collectively called baylands, which protect billions of dollars of bay-front housing and infrastructure (including neighborhoods, business parks, highways, sewage treatment plants, and landfills). They purify the Bay’s water, support endangered wildlife, nurture fisheries, and provide people access to nature within the urban environment. Bay Area residents showed their commitment to restoring these critical habitats when they voted for a property tax to pay for large-scale tidal marsh restoration. However, climate change poses a great threat, because there may not be enough natural sediment supply for tidal marshes and mudflats to gain elevation fast enough to keep pace with sea-level rise.
. 2021. Simulating Sediment Flux Through the Golden Gate. Prepared for Regional Monitoring Program for Water Quality in San Francisco Bay (RMP). SFEI Contribution No. 1033. San Francisco Estuary Institute: Richmond, CA.
2021. Study of Per- and Polyfluoroalkyl Substances in Bay Area POTWs: Phase 1, Sampling and Analysis Plan. SFEI Contribution No. 1020. San Francisco Estuary Institute: Richmond, CA.
2021. Summary for Managers: Non-targeted Analysis of Stormwater Runoff following the 2017 Northern San Francisco Bay Area Wildfires. SFEI Contribution No. 1045. San Francisco Estuary Institute: Richmond, CA.
Urban-wildland interfaces in the western US are increasingly threatened by the growing number and intensity of wildfires, potentially changing the type of contaminants released into the landscape as more urban structures are burned. In October 2017, the Tubbs, Nuns, and Atlas wildfires devastated communities in Northern California (Figure 1), burning over 8,500 buildings and 210,000 acres of land in the span of 24 days (California Department of Forestry and Fire Protection 2017). Together, these wildfires were the most destructive and costliest fires in the history of California at that time (California Department of Forestry and Fire Protection 2019).
Post-wildfire monitoring efforts in impacted watersheds typically focus on a few well-established water quality and chemistry concerns (McKee et al. 2018). Few studies go beyond these limited targeted analyses and attempt to identify the multitude of other fire-related compounds that are released from or form as the result of combustion of residential, commercial, and industrial structures in urban-wildland interfaces. Some of these unidentified compounds may be toxic to aquatic ecosystems or human health, and may pose risks to wildlife or in water bodies that act as drinking water supplies to nearby communities.
2021. A Synthesis of Microplastic Sources and Pathways to Urban Runoff. SFEI Contribution No. 1049. San Francisco Estuary Institute: Richmond, CA.
 California Senate Bill 1263 (2018) tasks the Ocean Protection Council (OPC) with leading statewide efforts to address microplastic pollution, and requires the OPC to adopt and implement a Statewide Microplastics Strategy related to microplastic materials that pose an emerging concern for ocean health. Key questions remain about the sources and pathways of microplastics, particularly to urban runoff, to inform an effective statewide microplastics management strategy. The OPC funded this work to inform these microplastics efforts. The purpose of this project was to build conceptual models that synthesize and integrate our current understanding of microplastic sources and pathways to urban runoff in order to provide future research priorities that will inform how best to mitigate microplastic pollution. Specifically, we developed conceptual models for cigarette butts and associated cellulose acetate fibers (Section 2), fibers other than cellulose acetate (Section 3), single-use plastic foodware and related microplastics (Section 4), and tire particles (Section 5), which were prioritized based on findings from the recent urban stormwater monitoring of microplastics in the San Francisco Bay region. Conceptual models specific to each of these particle types are valuable tools to refine source identification and elucidate potential source-specific data gaps and management options.
2020. Sampling and Quality Assurance and Quality Control: A Guide for Scientists Investigating the Occurrence of Microplastics Across Matrices. Applied Spectroscopy 74 (9) . SFEI Contribution No. 1012.
Plastic pollution is a defining environmental contaminant and is considered to be one of the greatest environmental threats of the Anthropocene, with its presence documented across aquatic and terrestrial ecosystems. The majority of this plastic debris falls into the micro (1 lm–5 mm) or nano (1–1000 nm) size range and comes from primary and secondary sources. Its small size makes it cumbersome to isolate and analyze reproducibly, and its ubiquitous distribution creates numerous challenges when controlling for background contamination across matrices (e.g., sediment, tissue, water, air). Although research on microplastics represents a relatively nascent subfield, burgeoning interest in questions surrounding the fate and effects of these debris items creates a pressing need for harmonized sampling protocols and quality control approaches. For results across laboratories to be reproducible and comparable, it is imperative that guidelines based on vetted protocols be readily available to research groups, many of which are either new to plastics research or, as with any new subfield, have arrived at current approaches through a process of trial-and-error rather than in consultation with the greater scientific community. The goals of this manuscript are to (i) outline the steps necessary to conduct general as
well as matrix-specific quality assurance and quality control based on sample type and associated constraints, (ii) briefly review current findings across matrices, and (iii) provide guidance for the design of sampling regimes. Specific attention is paid to the source of microplastic pollution as well as the pathway by which contamination occurs, with details provided regarding each step in the process from generating appropriate questions to sampling design and collection.
2020. Santa Clara County Five Watersheds Assessment: A Synthesis of Ecological Data Collection and Analysis Conducted by Valley Water. . SFEI Contribution No. 963. San Francisco Estuary Institute: Richmond. CA. p 71.
This report synthesizes the baseline assessments for Santa Clara County’s five watersheds to present similarities, differences, and compare ecological condition in streams across watersheds and their subregions, San Francisco Bay-Delta ecoregion, and statewide based on CRAM. It also interprets the assessment results and comparisons to identify risks to stream conditions, and opportunities for stream stewardship. Project D5’s baseline assessments establish a monitoring and assessment framework for evaluating the performance of Valley Water’s programs, projects, maintenance activities, and on-the-ground stewardship actions.
2020. Sediment Monitoring and Modeling Strategy. Sediment Monitoring and Modeling Strategy. SFEI Contribution No. 1016. San Francisco Estuary Institute: Richmond, CA.
. 2020. Sonoma Creek Baylands Strategy. Prepared by Sonoma Land Trust, San Francisco Estuary Institute, Point Blue Conservation Science, Environmental Science Associates, Ducks Unlimited, U.S. Fish and Wildlife Service.
2020. Special Study on Bulk Density. SFEI Contribution No. 975. San Francisco Estuary Institute: Richmond, CA. p 43.
Sediment bulk density is the total mass of mineral and organic sediment within a defined volume. It is a key variable in many research questions pertaining to Bay sediment studies but one that is often poorly quantified and can be misinterpreted. The motivation for this report comes from a recommendation by Schoellhamer et al. (2018) to compile more accurate estimates of bulk density of Bay sediments to convert between volume and mass with a higher level of certainty. Through funding and guidance from the Bay Regional Monitoring Program Sediment Work Group, this report is a first step towards compiling the available data on sediment bulk densities across Bay habitats and along salinity gradients to provide better information for resource managers and others working on sediment-related issues. This report discusses the need to know the bulk density of Bay soils to convert between sediment mass and soil volume; clarifies general definitions and common points of confusion related to sediment bulk density; compiles primary sources of bulk density measurements, secondary sources of bulk density estimates, and standard engineering estimates of bulk density for different habitats in San Francisco Bay; and, provides a database where practitioners can track, analyze, and share bulk density measurements.
2020. Sports and urban biodiversity. . SFEI Contribution No. 1028.
SFEI collaborated with the International Union for the Conservation of Nature (IUCN) and the International Olympic Committee (IOC) to create a guide to incorporating nature into urban sports, from the development of Olympic cities to the design and management of the many sport fields throughout the urban landscape. We applied the Urban Biodiversity Framework developed in Making Nature’s City to the world of sports, with case studies drawn from international sport federations, Olympic cities, and individual sport teams and venues around the world. The guide is part of IUCN’s ongoing collaboration with IOC to develop best practices around biodiversity for the sporting industry.
2020. Summary of Water Year 2017 precipitation, discharge, and sediment conditions at selected locations in Arroyo de la Laguna watershed, with a focus on Arroyo Mocho. SFEI Contribution No. 912. San Francisco Estuary Institute: Richmond, CA.
This report summarizes the precipitation, discharge, and sediment conditions observed from October 1, 2016 to September 30th, 2017 (Water Year (WY) 2017) in the Arroyo de la Laguna watershed, with a focus on the Arroyo Mocho watershed. This information was collected by the Zone 7 Water Agency to support operation and maintenance of their flood control facilities. Additionally, this and similar information collected in WY 2018 and 2019 will be utilized to update the Arroyo Mocho watershed sediment budget (Pearce et al, 2020).
2020. Suspended Sediment Flux in the San Francisco Estuary: Part I—Changes in the Vertical Distribution of Suspended Sediment and Bias in Estuarine Sediment Flux Measurements. Estuaries and Coasts . SFEI Contribution No. 990.
In this study, we investigate how changes in the vertical distribution of suspended sediment affect continuous suspended sediment flux measurements at a location in the San Francisco Estuary. Current methods for measuring continuous suspended sediment flux estimates relate continuous estimates of suspended-sediment concentration (SSC) measured at-a-point (SSCpt) to discrete cross-section measurements of depth-averaged, velocity-weighted SSC (SSCxs). Regressions that compute SSCxs from continuous estimates of SSCpt require that the slope between SSCpt and SSCxs, controlled by the vertical distribution of SSC, is fixed. However, in tidal systems with suspended cohesive sediment, factors that control the vertical SSC profile—vertical turbulent mixing and downward settling of suspended sediment mediated by flocculation of cohesive sediment—constantly vary through each tide and may exhibit systematic differences between flood and ebb tides (tidal asymmetries in water velocity or particle size). We account for changes in the vertical SSC profile on estimates of SSCxs using time series of the Rouse number of the Rouse-Vanoni-Ippen equation combined with optical turbidity measurements, a surrogate for SSCpt, to predict SSCxs from 2009 to 2011 and 2013. Time series of the Rouse number were estimated by fitting the Rouse-Vanoni-Ippen equation to SSC estimated from optical-turbidity measurements taken at two elevations in the water column. When accounting for changes in the vertical SSC profile, changes in not only the magnitude but also the direction of cumulative sediment-flux measurements were observed. For example, at a mid-depth sensor, sediment flux estimates changed from − 319 kt (± 65 kt, negative indicating net seaward transport) to 482 kt (± 140 kt, positive indicating net landward transport) for 2009–2011 and from − 388 kt (± 140 kt) to 1869 kt (± 406 kt) for 2013–2016. At the study location, estimation of SSCxs solely from SSCpt resulted in sediment flux values that were underestimates on flood tides and overestimates on ebb tides. This asymmetry is driven by covariance between water velocity and particle settling velocity (Ws) with larger Ws on flood compared to ebb tides. Results of this study indicate that suspended-sediment-flux measurements estimated from point estimates of SSC may be biased if systematic changes in the vertical distribution of SSC are unaccounted for.
2020. Suspended-sediment Flux in the San Francisco Estuary; Part II: the Impact of the 2013–2016 California Drought and Controls on Sediment Flux. Estuaries and Coasts. SFEI Contribution No. 1137. Estuaries and Coasts.
Recent modeling has demonstrated that sediment supply is one of the primary environmental variables that will determine the sustainability of San Francisco Estuary tidal marshes over the next century as sea level rises. Therefore, understanding the environmental controls on sediment flux within the San Francisco Estuary is crucial for optimal planning and management of tidal marsh restoration. Herein, we present suspended-sediment flux estimates from water year (WY) 2009–2016 from the San Francisco Estuary to investigate the environmental controls and impact of the record 2013–2016 California drought. During the recent drought, sediment flux into Lower South Bay, the southernmost subembayment of the San Francisco Estuary, increased by 345% from 114 kt/year from WY 2009 to 2011 to 508 kt/year from WY 2014 to 2016, while local tributary sediment flux declined from 209 to 51 kt/year. Total annual sediment flux from WY 2009 to 2011 and 2014 to 2016 can be predicted by total annual freshwater inflow from the Sacramento-San Joaquin Delta (R2 = 0.83, p < 0.01), the primary source of freshwater input into the San Francisco Estuary. The volume of freshwater inflow from the Sacramento-San Joaquin Delta is hypothesized to affect shoal-to-channel density gradients that affect sediment flux from broad, typically more saline and turbid shoals, to the main tidal-channel seaward of Lower South Bay. During the drought, freshwater inflow from the Sacramento-San Joaquin Delta decreased, and replacement of typically more saline shoal water was reduced. As a result, landward-increasing cross-channel density gradients enhanced shoal-to-channel advective flux that increased sediment available for tidal dispersion and drove an increase in net-landward sediment flux into Lower South Bay.
2019. San Francisco Bay Microplastics Project: Science-Supported Solutions and Policy Recommendations. SFEI Contribution No. 955. 5 Gyres: Los Angeles, CA.
 Plastics in our waterways and in the ocean, and more specifically microplastics (plastic particles less than 5 mm in size), have gained global attention as a pervasive and preventable threat to marine ecosystem health. The San Francisco Bay Microplastics Project was designed to provide critical data on microplastics in the Bay Area. The project also engaged multiple stakeholders in both science and policy discussions. Finally, the project was designed to generate scientifically supported regional and statewide policy recommendations for solutions to plastic pollution.
. 2019. San Francisco Bay Shoreline Adaptation Atlas: Working with Nature to Plan for Sea Level Rise Using Operational Landscape Units. SFEI Contribution No. 915. SFEI & SPUR: Richmond, CA. p 255.
As the climate continues to change, San Francisco Bay shoreline communities will need to adapt in order to build social and ecological resilience to rising sea levels. Given the complex and varied nature of the Bay shore, a science-based framework is essential to identify effective adaptation strategies that are appropriate for their particular settings and that take advantage of natural processes. This report proposes such a framework—Operational Landscape Units for San Francisco Bay.
2019. San Francisco Bay Triennial Bird Egg Monitoring Program for Contaminants, California—2018. U.S. Geological Survey: Reston, Virginia.
2019. Selenium in White Sturgeon from North San Francisco Bay: The 2015-2017 Sturgeon Derby Study. SFEI Contribution No. 897. San Francisco Estuary Institute: Richmond, CA.
This report presents the findings from a study evaluating selenium concentrations in white sturgeon (Acipenser transmontanus) tissues collected during the 2015-2017 Sturgeon Derby events in North San Francisco Bay. The goal of this study was to investigate the distribution of selenium among sturgeon tissues to inform the toxicological and regulatory interpretation of selenium measured in non-lethally collected tissues, including muscle plugs and fin rays. This technical report provides documentation of the study and presents its major findings.
2019. Small Tributaries Pollutants of Concern Reconnaissance Monitoring: Pilot Evaluation of Source Areas Using PCB Congener Data. SFEI Contribution No. 956. San Francisco Estuary Institute: Richmond, CA.
2019. Small Tributaries Pollutants of Concern Reconnaissance Monitoring: Loads and Yields-based Prioritization Methodology Pilot Study. SFEI Contribution No. 817. San Francisco Estuary Institute: Richmond, CA.
2018. Screening of Pharmaceuticals in San Francisco Bay Wastewater. SFEI Contribution No. 910. San Francisco Estuary Institute : Richmond, CA.
2018. SediMatch Factsheet.
2018. Sediment Supply to San Francisco Bay. SFEI Contribution No. 842. San Francisco Estuary Institute : Richmond, CA.
2018. Selenium in Muscle Plugs of White Sturgeon from North San Francisco Bay, 2015-2017. SFEI Contribution No. 929. San Francisco Estuary Institute : Richmond, CA.
2018. Selenium in White Sturgeon from North San Francisco Bay: The 2015-2017 Sturgeon Derby Study - (Coming Soon). SFEI Contribution No. 897. San Francisco Estuary Institute : Richmond, CA.
2018. Statistical Methods Development and Sampling Design Optimization to Support Trends Analysis for Loads of Polychlorinated Biphenyls from the Guadalupe River in San Jose, California, USA. SFEI Contribution No. 876. Applied Marine Sciences: Livermore, CA.
2018. Status & Trends Monitoring Design: 2018 Update. San Francisco Estuary Institute : Richmond, CA.
2018. Support for Sediment Bioaccumulation Evaluation: Toxicity Reference Values for the San Francisco Bay. SFEI Contribution No. 916. San Francisco Estuary Institute : Richmond, CA.
2018. Sycamore Alluvial Woodland Planting Guide. SFEI Contribution No. 901.
2017. Sampling and Analysis Plan for Microplastic Monitoring in San Francisco Bay and Adjacent National Marine Sanctuaries. SFEI Contribution No. 819. San Francisco Estuary Institute: Richmond, CA.
2017. San Francisco Bay California Toxics Rule Priority Pollutant Ambient Water Monitoring Report. SFEI Contribution No. 814. San Francisco Estuary Institute: Richmond.
2017. San Francisco Bay Interim Model Validation Report. SFEI Contribution No. 850. San Francisco Estuary Institute: Richmond, CA.
2017. San Leandro Bay PCB Study Data Report. SFEI Contribution No. 855. San Francisco Estuary Institute: Richmond, CA.
2017. Selenium in White Sturgeon Tissues: 2015 Sturgeon Derby. SFEI Contribution No. 834.
2017. Sycamore Alluvial Woodland: Habitat Mapping and Regeneration Study. SFEI Contribution No. 816.
This study investigates the relative distribution, health, and regeneration patterns of two major stands of sycamore alluvial woodland (SAW), representing managed and natural settings. Using an array of ecological and geomorphic field analyses, we discuss site characteristics favorable to SAW health and regeneration, make recommendations for restoration and management, and identify next steps. Findings from this study will contribute to the acquisition, restoration, and improved management of SAW as part of the Santa Clara Valley Habitat Plan (VHP).
2016. Sampling and Analysis Plan for 2016 RMP Status and Trends Bird Egg Monitoring. SFEI Contribution No. 827. San Francisco Estuary Institute: Richmond, CA. p 31 pp.
2016. San Francisco Bay Nutrient Management Strategy Observation Program. SFEI Contribution No. 877. San Francisco Estuary Institute: Richmond, CA.
2016. San Francisco Bay Shore Inventory: Mapping for Sea Level Rise Planning. SFEI Contribution No. 779. San Francisco Estuary Institute: Richmond, CA.
With rising sea levels and the increased likelihood of extreme weather events, it is important for regional agencies and local municipalities in the San Francisco Bay Area to have a clear understanding of the status, composition, condition, and elevation of our current Bay shore, including both natural features and built infrastructure.
The purpose of this Bay shore inventory is to create a comprehensive and consistent picture of today’s Bay shore features to inform regional planning. This dataset includes both structures engineered expressly for flood risk management (such as accredited levees) and features that affect flooding at the shore but are not designed or maintained for this purpose (such as berms, road embankments, and marshes). This mapping covers as much of the ‘real world’ influence on flooding and flood routing as possible, including the large number of non-accredited structures.
This information is needed to:
- identify areas vulnerable to flooding.
- identify adaptation constraints due to present Bay shore alignments; and
- suggest opportunities where beaches, wetlands, and floodplains can be maintained or restored and integrated into flood risk management strategies.
The primary focus of the project is therefore to inform regional planners and managers of Bay shore characteristics and vulnerabilities. The mapping presented here is neither to inform FEMA flood designation nor is it a replacement for site-specific analysis and design.
The mapping consists of two main elements:
- Mapping of Bay shore features (levees, berms, roads, railroads, embankments, etc.) which could affect flooding and flood routing.
- Attributing Bay shore features with additional information including elevations, armoring, ownership (when known), among others.
SFEI delineated and characterized the Bay shore inland to 3 meters (10ft) above mean higher high water (MHHW) to accommodate observed extreme water levels and the commonly used range of future sea level rise (SLR) scenarios. Elevated Bay shore features were mapped and classified as engineered levees, berms, embankments, transportation structures, wetlands, natural shoreline, channel openings, or water control structures. Mapped features were also attributed with elevation (vertical accuracy of <5cm reported in 30 meter (100ft) segments from LiDAR derived digital elevation models (DEMs), FEMA accreditation status, fortification (e.g., riprap, buttressing), frontage (e.g., whether a feature was fronted by a wetland or beach), ownership, and entity responsible for maintenance. Water control structures, ownership, and maintenance attributes were captured where data was available (not complete for entire dataset). The dataset was extensively reviewed and corrected by city, county, and natural resource agency staff in each county around the Bay. This report provides further description of the Bay shore inventory and methods used for developing the dataset. The result is a publicly accessible GIS spatial database.
2016. San Francisco Bay Triennial Bird Egg Monitoring Program for Contaminants - 2016 Data Summary. U.S. Geological Survey: Dixon, CA. p 19 pp.
As part of the Regional Monitoring Program (RMP) and the USGS’s long-term Wildlife Contaminants Program, the USGS samples double-crested cormorant (Phalacrocorax auritus) and Forster’s tern (Sterna forsteri) eggs throughout the San Francisco Bay Estuary approximately every three years to assess temporal trends in contaminant concentrations. This sampling has been carried out in 2006, 2009, and 2012. Although RMP sampling was scheduled to take place in 2015, it was delayed until 2016. This document summarizes egg collections for 2016, as well as mercury concentrations in Forster’s tern eggs on an individual egg basis.
2016. San Francisquito Creek Baylands: Landscape Change Metrics Analysis. Flood Control 2.0. SFEI Contribution No. 784. San Francisco Estuary Institute - Aquatic Science Center: Richmond, CA. p 12.
Major Findings
Over the past 150 years, lower San Francisquito Creek and the adjacent baylands have been modified for the sake of land reclamation and flood control. This study focused on developing an understanding of the magnitude of habitat change since the mid-19th century through comparisons of key historical and contemporary landscape-scale habitat features, as well as several key landscape metrics that relate to ecological functions and landscape resilience. The major findings from the analyses conducted for this study are as follows:
• Historically, the San Francisquito Creek Baylands included a mosaic of habitat types, including an extensive tidal marsh plain with salt pannes and an expansive tidal channel network, a broad bay flat, and a relatively wide contiguous low-gradient tidal-terrestrial transition zone.
• Since the late 19th century, a combination of land reclamation and the inland migration of the shoreline has resulted in a 55% decrease in tidal marsh area, a 67% decrease in total tidal channel length, a 40% reduction in channel flat area, a 20% increase in bay flat area, and a 95% decrease in tidal-terrestrial transition zone length.
• Land reclamation has also resulted in the creation of new features that did not exist in the area historically including tidal lagoons, non-tidal open water features, and non-tidal wetlands.
Recommendations
The findings from this study provide insight into the drivers for and magnitude of habitat change within the San Francisquito Creek Baylands, and can therefore help inform climate-resilient approaches for regaining some of the lost landscape features and ecological functions. Specific management recommendations developed from the study findings are as follows:
• The dramatic decrease in tidal marsh area and associated tidal channel length since the mid-1800s make tidal marsh restoration a high priority. To make restored areas sustainable over the long-term, restoration should include reestablishing regular tidal inundation as well as reestablishing a connection with San Francisquito Creek and the delivery of freshwater and fine sediment. Restoration efforts should focus on large contiguous areas with minimal infrastructure and should ideally be done sometime over the next decade to ensure the restored areas will have a chance of surviving the sharp increase in the rate of sea level rise that is predicted to occur around 2030 (Goals Update 2015).
• Similarly, the dramatic decrease in the tidal-terrestrial transition zone makes it a high priority for any restoration vision for this area. The transition zone provides distinct ecological services and marsh migration space, and is in need of restoration throughout the South Bay. Since most of the upland land along the historical tidal-terrestrial transition zone is currently developed, near-term restoration efforts should focus on creating transition zone habitats on the bayside of flood risk management levees (Goals Update 2015).
• The landscape metrics used in this study (tidal habitat area, tidal channel length, and tidal-terrestrial interface length) can be used to help design resilient landscape restoration and adaptation strategies around the mouth of San Francisquito Creek. Specifically, the metrics can be used to assess the long-term ecological benefit associated with various processes-based restoration approaches (i.e., approaches that create habitat features and establish physical processes required for habitat resilience). Additional useful landscape metrics are being developed as part of the Resilient Silicon Valley project (see Robinson et al. 2015).
2016. Simple Mass Budget Model to Evaluate Long Term PCB Fate in the Emeryville Crescent Sub-embayment.
2016. Sources, Pathways and Loadings: Multi-Year Synthesis with a Focus on PCBs and Hg. SFEI Contribution No. 773.
2016. Summary and Evaluation of Delta Subregions for Nutrient Monitoring and Assessment. SFEI Contribution No. 789.
2016. Synthesis of Current Science: Influence of Nutrient Forms and Ratios on Phytoplankton Production and Community Composition. SFEI Contribution No. 862. San Francisco Estuary Institute : Richmond, CA.
2015. Sediment Supply, deposition, and transport in the Flood Control Facilities of Arroyo Mocho and Arroyo Las Positas from 2006-2014. . SFEI Contribution No. 771. San Francisco Estuary Institue: Richmond, CA.
2015. Shifting Shores: Marsh Expansion and Retreat in San Pablo Bay. SFEI Contribution No. 751.
EXECUTIVE SUMMARY
As sea level rise accelerates, our shores will be increasingly vulnerable to erosion. Particular concern centers around the potential loss of San Francisco Bay’s much-valued tidal marshes, which provide natural flood protection to our shorelines, habitat for native wildlife, and many other ecosystem services. Addressing this concern, this study is the first systematic analysis of the rates of marsh retreat and expansion over time for San Pablo Bay, located in the northern part of San Francisco Bay.
Key findings:
• Over the past two decades, more of the marshes in San Pablo Bay have expanded (35% by length) than retreated (6%).
• Some areas have been expanding for over 150 years.
• Some marsh edges that appear to be retreating are in fact expanding rapidly at rates of up to 8 m/yr.
• Marsh edge change may be a useful indicator of resilience, identifying favorable sites for marsh persistence.
• These data can provide a foundation for understanding drivers of marsh edge expansion and retreat such as wind direction, wave energy, watershed sediment supply, and mudflat shape.
• This understanding of system dynamics will help inform management decisions about marsh restoration and protection.
• This study provides a baseline and method for tracking marsh edge response to current and future conditions, particularly anticipated changes in sea level, wave energy, and sediment supply.
Recommended next steps:
• This pilot study for San Pablo Bay marshes should be extended to other marshes in San Francisco Bay.
• These initial marsh expansion and retreat findings should be further analyzed and interpreted to improve our understanding of system drivers and identify management responses.
• A program for repeated assessment should be developed to identify and track changes in shoreline position, a leading indicator of the likelihood marsh survival.
2014. San Francisco Bay Nutrient Management Strategy: Detailed Modeling Workplan for FY15-FY21. San Francisco Estuary Institute: Richmond, CA.
2014. San Francisco State University Site 1 Vegetated Infiltration Basin (Case Study Site and Technical Reports). SFEI Contribution No. 794.
2014. San Francisco State University Site 3 Basin and Swale System (Case Study Site and Technical Reports). SFEI Contribution No. 795.
2014. Santa Rosa Plain Wetlands Profile: A Demonstration of the CaliforniaWetland and Riparian Area Monitoring Plan. SFEI Contribution No. 726. San Francisco Estuary Institute - Aquatic Science Center: Richmond, CA. p 46.
2014. Suisun Bay Ammonium Synthesis. SFEI Contribution No. 706. San Francisco Estuary Institute: Richmond, CA. p 191.
2014. Sunset Circle Vegetated Swale and Infiltration System (Case Study Site and Technical Reports). SFEI Contribution No. 796.
2013. Seasonal and annual trends in forage fish mercury concentrations, San Francisco Bay. Science of the Total Environment 444, 591-601.
2013. Seasonal and annual trends in forage fish mercury concentrations, San Francisco Bay. Science of the Total Environment 444, 591-601.
2013. Seasonal variations in suspended-sediment dynamics in the tidal reach of an estuarine tributary. Marine Geology 345, 314-326.
2013. A sediment budget for the southern reach in San Francisco Bay, CA: Implications for habitat restoration. Marine Geology 345, 281-293.
2013. Sediment transport in the San Francisco Bay Coastal System: An overview. Marine Geology Special Issue: A multi-discipline approach for understanding sediment transport and geomorphic evolution in an estuarine-coastal system.
2013. Statistical Design, Analysis, and Graphics for the Guadalupe River Watershed Assessment 2012. SFEI Contribution No. 687. San Francisco Estuary Institute: Richmond, CA.
2012. Sacramento-San Joaquin Delta Historical Ecology Investigation: Exploring Pattern and Process. SFEI Contribution No. 672. SFEI: Richmond.
The Sacramento-San Joaquin Delta has been transformed from the largest wetland system on the Pacific Coast of the United States to highly productive farmland and other uses embodying California’s water struggles. The Delta comprises the upper extent of the San Francisco Estuary and connects two-thirds of California via the watersheds that feed into it. It is central to the larger California landscape and associated ecosystems, which will continue to experience substantial modification in the future due to climate change and continued land and water use changes. Yet this vital ecological and economic link for California and the world has
been altered to the extent that it is no longer able to support needed ecological functions. Approximately 3% of the Delta’s historical tidal wetland extent remains wetland today; the Delta is now crisscrossed with agricultural ditches replacing the over 1,000 miles of branching tidal channels.
Imagining a healthy Delta ecosystem in the future and taking bold, concrete steps toward that future requires an understanding and vision of what a healthy ecosystem looks like. For a place as extensive, unique, and modified as the Delta, valuable knowledge can be acquired through the study of the past, investigating the Delta as it existed just prior to the substantial human modifications of the last 160 years. Though the Delta is irrevocably altered, this does not mean that the past is irrelevant. Underlying geologic and hydrologic processes still influence the landscape, and native species still ply the waters, soar through the air, and move across the land. Significant opportunities are available to strategically reconnect landscape components in ways that support ecosystem resilience to both present and future stressors.
2012. Selenium Fractionation and Speciation in Final Effluents of Selected San Francisco Bay Area Municipal Wastewater Treatment Facilities. San Francisco Estuary Institute: Richmond.
2011. Sources of mercury to San Francisco Bay surface sediment as revealed by mercury stable isotopes. Geochimica et Cosmochimica Acta 75 (3), 691-705.
2011. SWAMP/RMP/Bight Program Report on Contaminants in Fish from the California Coast. California State Water Resources Control Board: Sacramento, CA.
2010. Selenium in the Grasslands Watershed. San Francisco Estuary Institute: Oakland, CA. pp 267-294.
2010. Shifting Baselines in a California Oak Savanna: Nineteenth Century Data to Inform Restoration Scenarios. Restoration Ecology 19 (101), 88-101 . SFEI Contribution No. 593.
For centuries humans have reduced and transformed Mediterranean-climate oak woodland and savanna ecosystems, making it difficult to establish credible baselines for ecosystem structure and composition that can guide ecological restoration efforts. We combined historical data sources, with particular attention to mid-1800s General Land Office witness tree records and maps and twentieth century air photos, to reconstruct 150 years of decline in extent and stand density of Valley oak (Quercus lobata Neé) woodlands and savannas in the Santa Clara Valley of central coastal California. Nineteenth century Valley oak woodlands here were far more extensive and densely stocked than early twentieth century air photos would suggest, although reconstructed basal areas (7.5 m2/ha) and densities (48.9 trees/ha) were not outside the modern range reported for this ecosystem type. Tree densities and size distribution varied across the landscape in relation to soil and topography, and trees in open savannas were systematically larger than those in denser woodlands. For the largest woodland stand, we estimated a 99% decline in population from the mid-1800s to the 1930s. Although most of the study area is now intensely developed, Valley oaks could be reintroduced in urban and residential areas as well as in surrounding rangelands at densities comparable to the native oak woodlands and savannas, thereby restoring aspects of ecologically and culturally significant ecosystems, including wildlife habitat and genetic connectivity within the landscape.